Kochava gives marketers the insights to make the tough decisions
Your CFO has just told you to cut your ad spend budget by 30%. How do you know which 30% to cut? Without the right data and insights at your fingertips, you could end up making decisions that cost your bottom line revenue far more than the initial spend savings achieved. Gravitating toward the media partners with the cheapest cost-per-install (CPI) rates or evenly cutting spend across each of your partners may seem like quick-fix options. However, it’s only by understanding each media channel’s and partner’s true efficiency that your decisions will have a lasting and positive impact.
Getting your hands on the data and insights you need to make ad budget cuts wisely is possible with an omni-channel marketing expert like Kochava. In this post, we’ll unpack how Kochava can help you:
- Holistically measure your omni-channel marketing
- Detect which partners are cheating through fraud
- Understand retention and churn trends by strategy & partner
- Determine media mix overlap and reduce redundancy
- Aggregate cost data to see your return on ad spend (ROAS) clearly
Let’s dive into more detail on each.
Measure Everything = Holistic Measurement
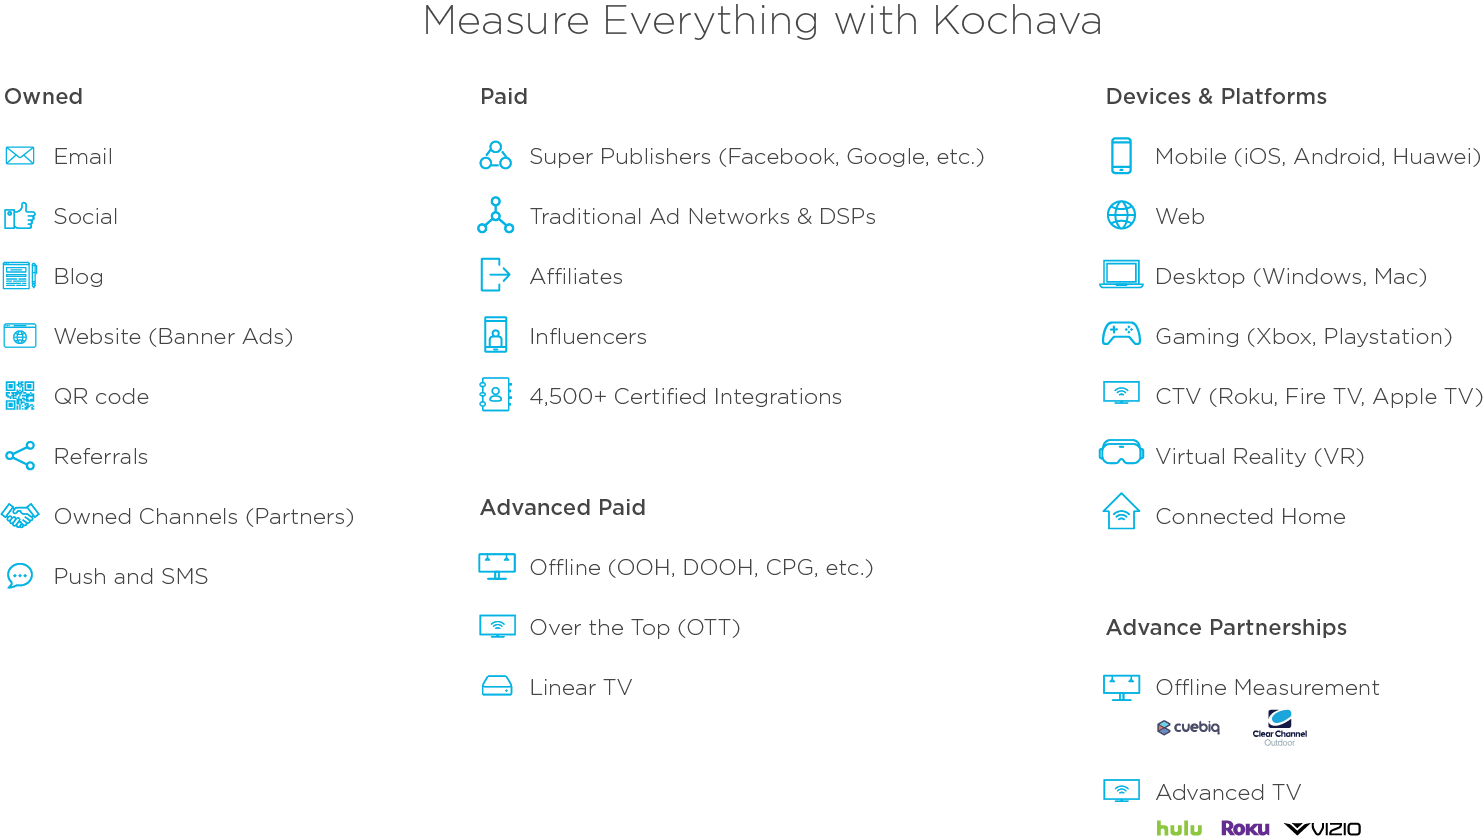
Start with a strong foundation. Measuring all of your omni-channel marketing efforts is essential to achieving a clear, holistic worldview. Your owned media across non-paid channels is a vital part of this. Many of the teams we start working with are consumed with measuring their paid media efforts, but don’t realize what a blind spot they have when it comes to their owned media. If you’re not measuring your owned media, you can’t give it the credit it deserves.
Having truly holistic measurement across your omni-channel media mix helps you to better discern the performance contrast amongst your partners and efforts. Seeing the complete picture, you can focus and invest in the top performers while trimming out the lowest performers. Further, it’s only against this holistic backdrop that all of the subsequent points we talk about are feasible.
This is why we champion the motto of “Measure Everything.” The visual representation below articulates the breadth and depth of what Kochava can help brands and marketers measure across devices, channels, and partners.
Saying ‘No’ to fraud
If you ever find yourself thinking that your campaign performance seems too good to be true – it probably is. Mobile ad fraud masquerades itself in many forms, so don’t ignore your suspicions and apply frequent sniff tests.
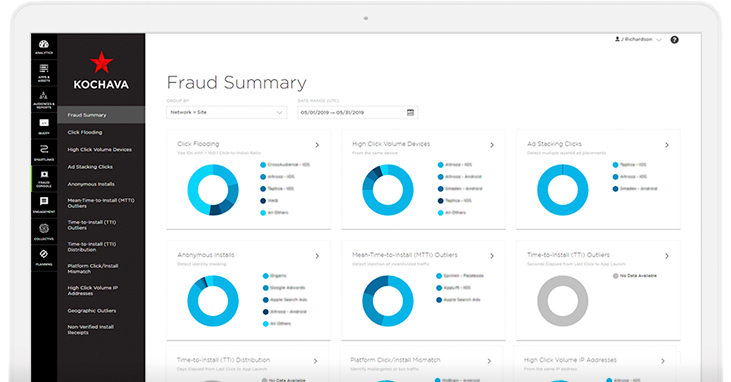
Not only does Kochava come with built-in fraud prevention that detects fraud and blocks it in real-time, but we also report the fraudulent traffic. This means you can dissect campaign data across partners to see which partners are disproportionately flagged for fraud.
If you’re looking to trim spend, consider having tough conversations with partners that over-index for fraud. If they’re not willing to clean up the publisher sources within their network inventory that are being cited and flagged, it may be an indication that it’s time to move on and save the spend or put it to better use elsewhere.
Retention and churn analysis
User retention and churn is a great method to measure and compare media partners and tactics. With Kochava, marketers can analyze retention rates across D1, D3, D7, D14, D30, and beyond or anywhere in between. Turnkey analytics dashboards or reports allow for quick retention insights, while Kochava Query can be utilized to make custom churn reports based on the key performance indicators (KPIs) most important to you. Be sure to continue to invest in the partners delivering quality users with the longest retention, while taking a hard look at partners or strategies that are under-indexing on retention.
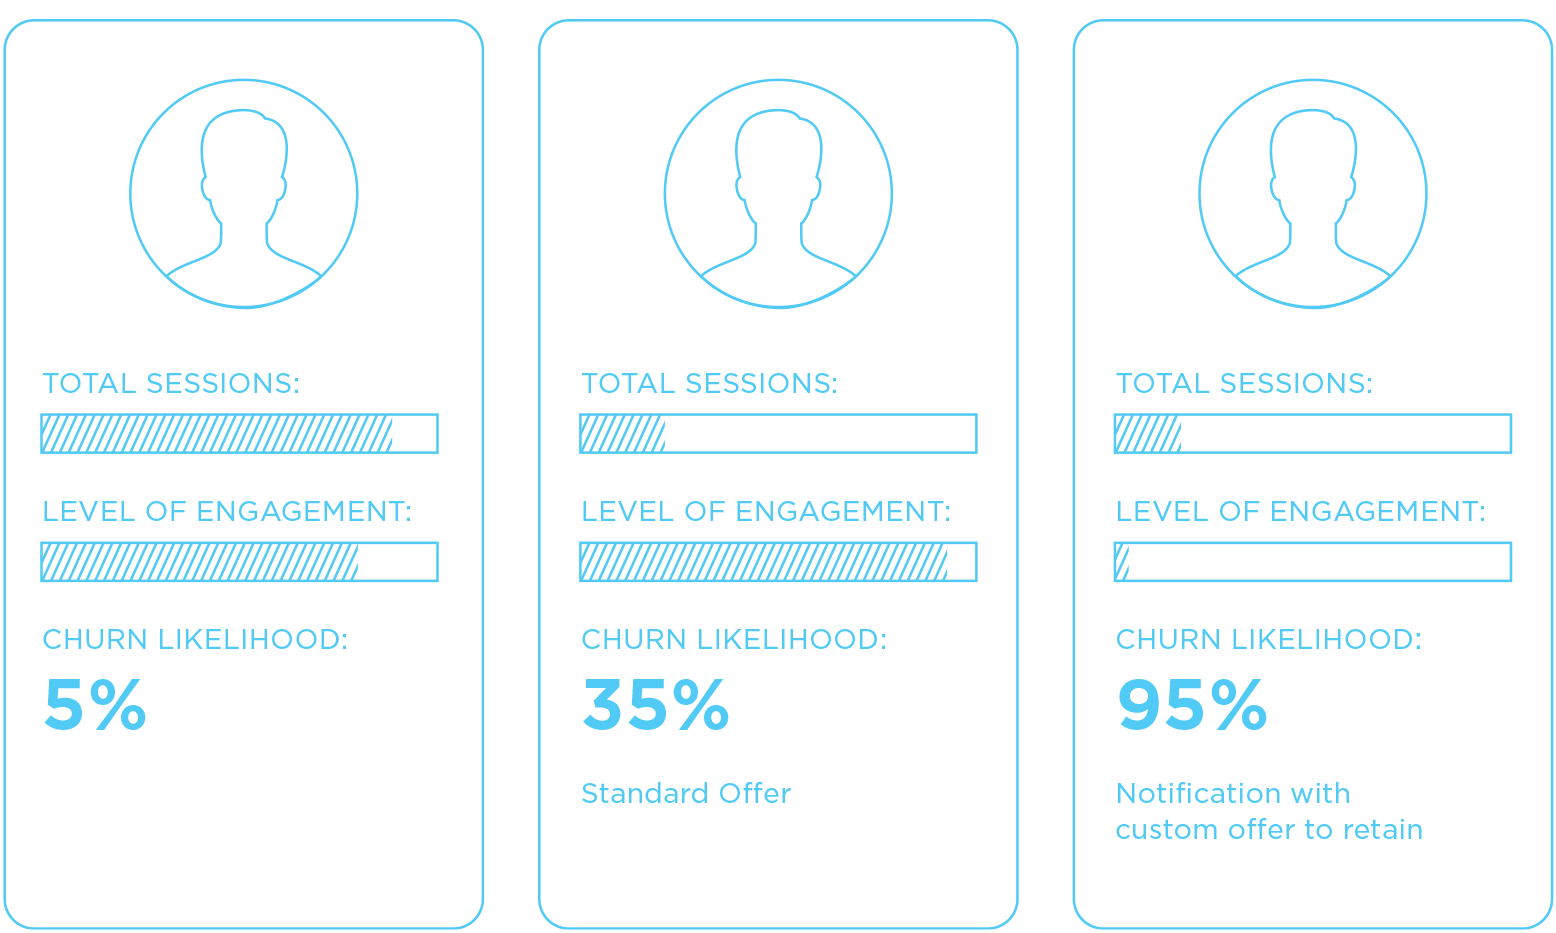
Kochava also runs predictive churn modeling that monitors user engagement post-install and predicts with a high-level of accuracy which users are most likely to churn between D8 – D38 post-install. In addition to our standard churn modeling, Kochava FoundryTM, our in-house team of data scientists and client analytics experts, can curate custom churn models based on the needs of individual apps or brands.
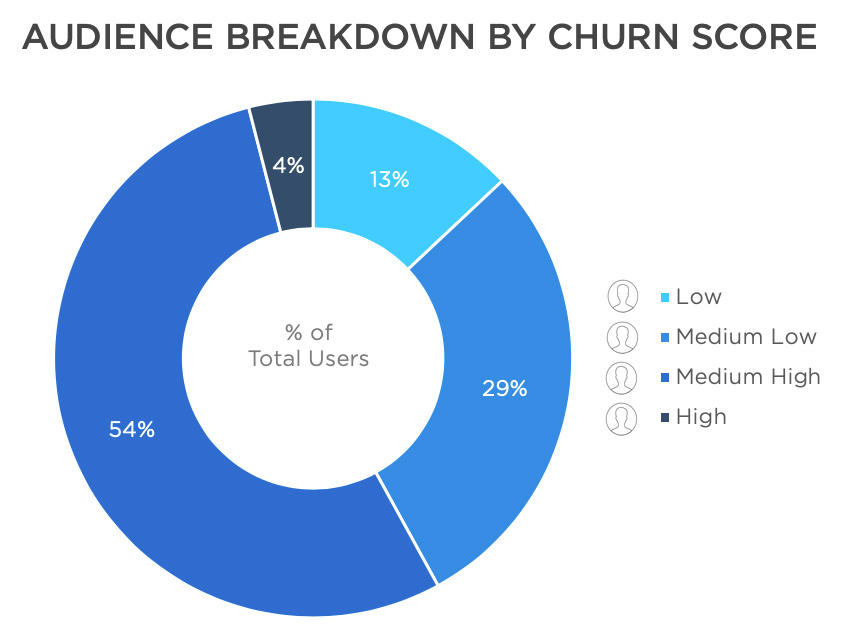
Churn scores can range from low to medium-low, medium-high, to high. Analyzing marketing campaigns and media partners by how the acquired audience performs in terms of churn score distribution is a great quality indicator to direct potential budget cuts.
Media mix overlap & redundancy
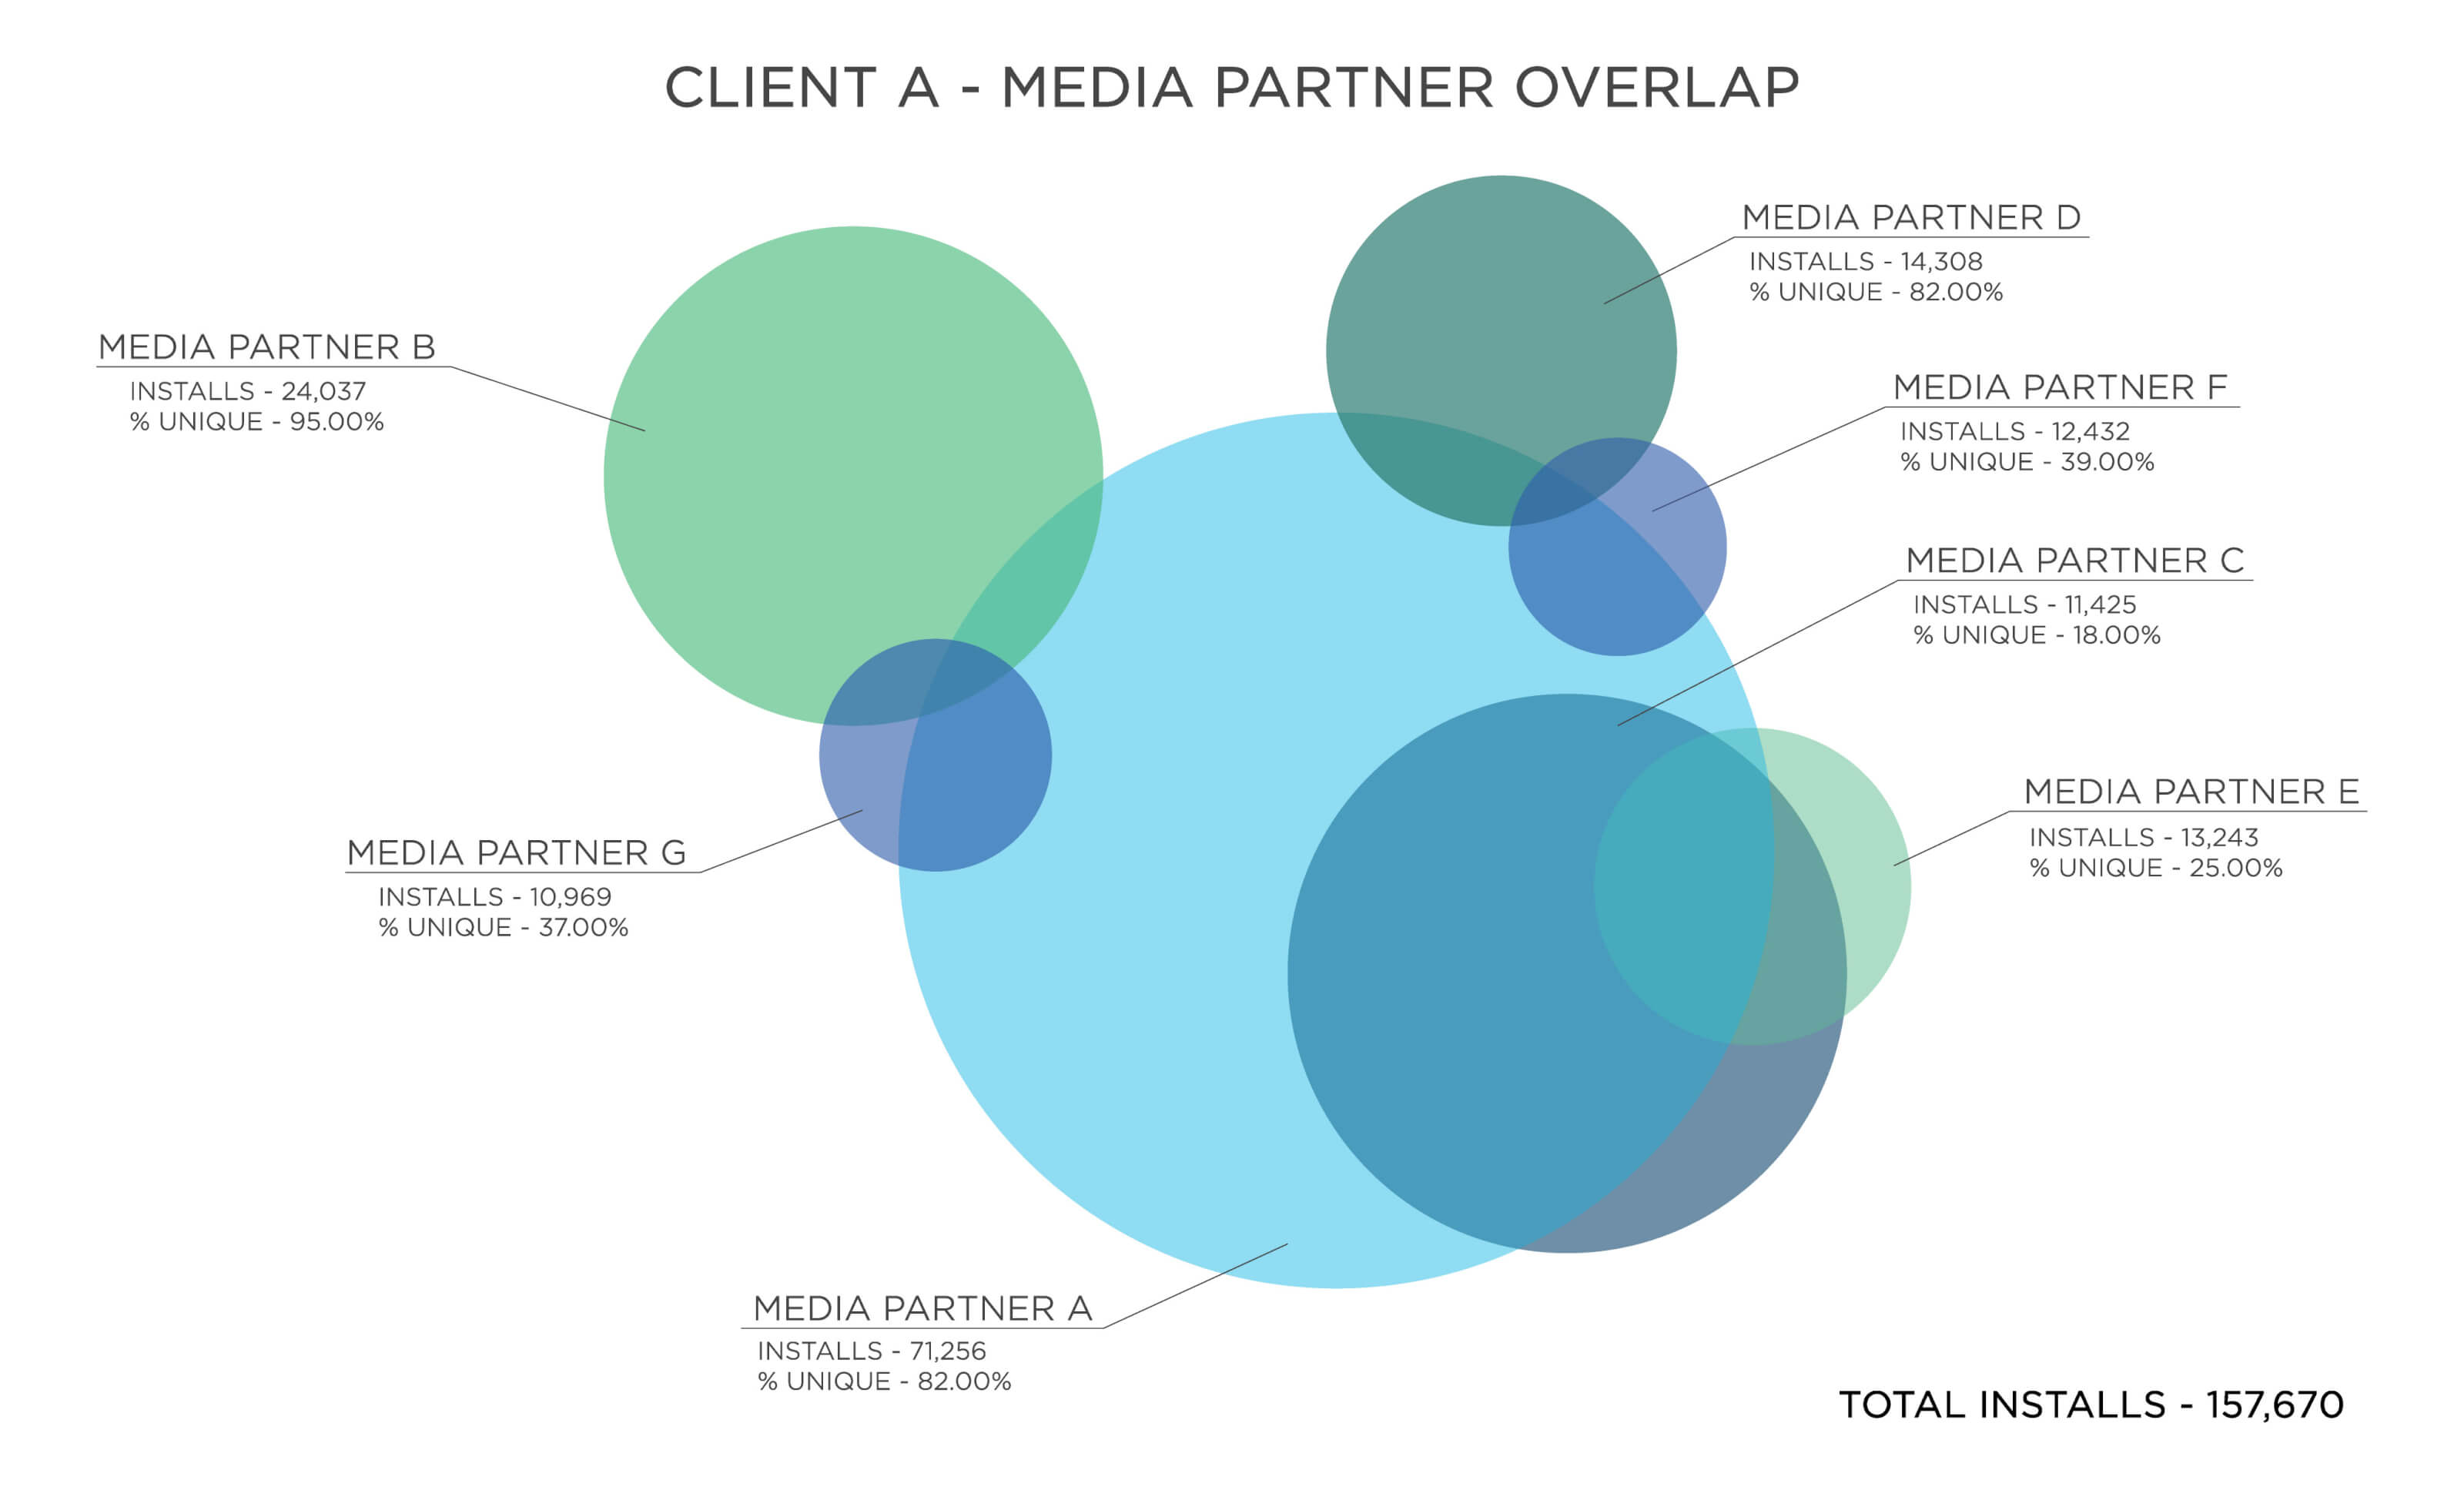
Multi-touch attribution (MTA) and influencer reporting provides marketers with great insights into how unique their reach is and where media partners are overlapping (e.g. serving ads to the same users). While some cross-influence between ad networks may be desirable, we strongly recommend a Kochava influencer impact analysis. We can help marketers understand their media mix overlap in the context of a user quality index. This underscores how influence position between multiple networks impacts post-install performance, which can factor in specific event completions, in-app revenue, retention, and other indicators.
If a particular partner delivers high-quality traffic that’s highly unique (e.g., no other media partner reached those same users), then you don’t want to cut their spend. However, if another network has little-to-no unique reach and consistently surfaces as an influencer behind your more quality sources, removing them from your media mix will not negatively impact your overall reach and growth.
Unify your cost data
Marketers can’t make clear decisions on budget cuts if they don’t have easy access to their costs across media partners. A common headache for marketers is having to dashboard hop between their various media partners to gather their spend data themselves. Only then can they build a spreadsheet and calculate their total costs.
On the other hand, Kochava Cost enables marketers to configure all of their media partners in one dashboard, pull in omni-channel spend data automatically, and quickly see what their total costs are. In-app revenue can also be taken into account to auto-calculate ROAS, helping marketers see the true return across every partner, campaign, creative, keyword, or other campaign variable.
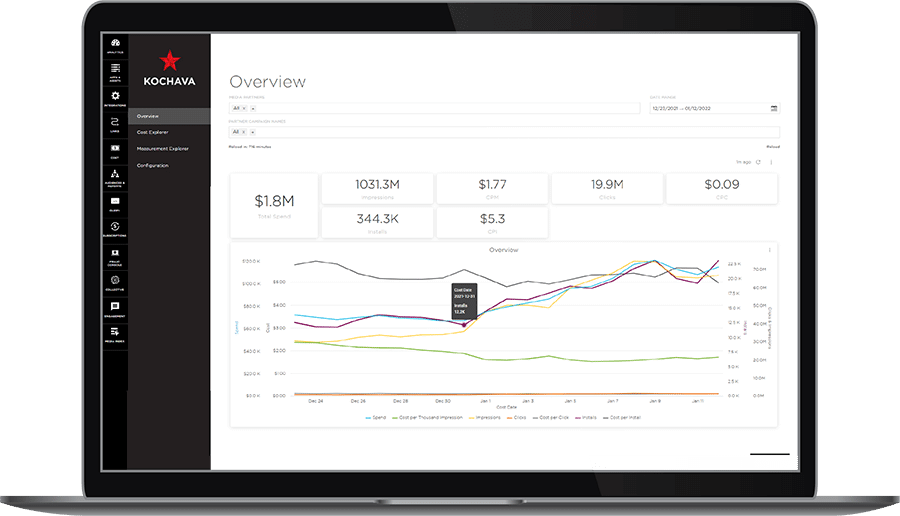
This easy access to cost and ROAS metrics enables marketers to take the guesswork out of their decisions and take quick action that will truly benefit the bottom line.
Want help making budget cut decisions?
We’re here to help. If you’re not currently a customer, contact us. If you already use Kochava, please contact your Client Success Manager or email support@kochava.com.
Looking for other smart savings? Check out the other ways we’re helping marketers save every day. Visit: https://www.kochava.com/smart-savings-for-marketers/
Stay up-to-date with the latest news by subscribing to our newsletter.


