Utilizing Kochava’s Analytics Zone
Takeaways
>2M
Analyzed Installs in First 3 Months (Across 2 Apps)
>1M
Monthly Active Users
(MAU)
>5K
Daily Active Users
(DAU)

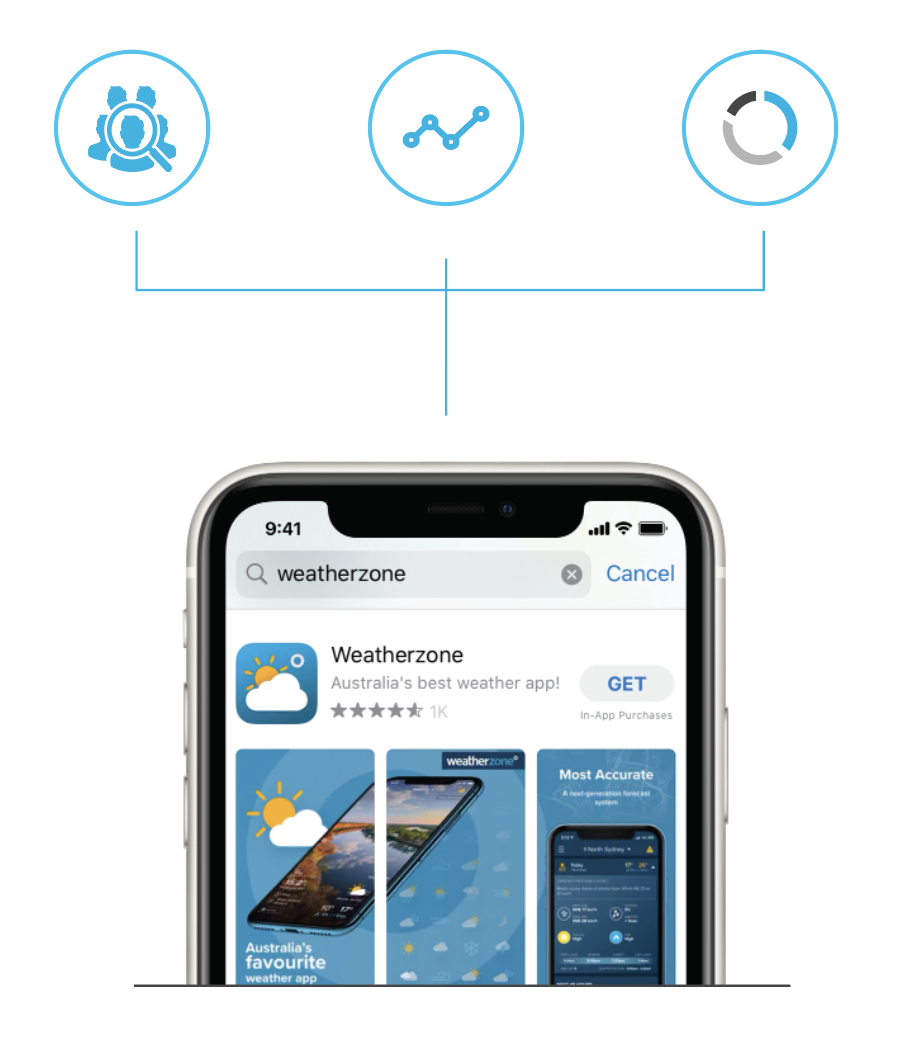
About
Weatherzone, Australia’s leading commercial weather information and presentation provider, supplies weather information over the web, mobile, print, and radio.
Challenge
Every day, hundreds of thousands of people go to Weatherzone to check the weather, stay up-to-date on storms, and other weather-related information. Just as Weatherzone’s users rely on a real-time stream of weather information, Weatherzone needed a place to gather a real-time stream of their app activity.
Solution
As soon as Weatherzone integrated with the Kochava SDK, they were able to gather and view their data quickly. When a user installs and opens the app for the first time, Kochava inputs key performance data into the dashboard in real-time. As the user moves through the app and completes events, Weatherzone can see what types of users click on certain links, images, or pages, instantly.
All of this information is presented in a variety of charts and views so that Weatherzone can see their users, events, and revenue as well as networks they work with and device information from their user’s mobile devices. This data can be broken down even further by adding filters and splitting the data into more granular categories. All of this data can then be used in custom reports that can be pulled in a variety of ways to suit the needs of the marketer.
Impact
By using Kochava’s analytics tools and detailed reporting, Weatherzone can gather real-time, cross-app data which has allowed them to make more strategic, direct marketing decisions to increase installs and subscriptions.