30-Minute Webinar | Why Strategic Losing Can Be a Winning Strategy on ASA. Nov 21 at 4PM London / 8AM PST
Leading fraud abatement since 2015
Long before mobile advertising fraud was on the radar for brand advertisers, sophisticated performance advertisers were learning that it was a costly and challenging problem. As a measurement provider for some of the highest-volume performance advertisers, Kochava recognized abnormalities in campaign data that in some cases were fraudulent. Thus, began the fight against mobile advertising fraud, and since 2015, we’ve been developing the most astute tools to prevent, identify, and abate it.
Networks caught in the middle of mobile advertising fraud
Mobile advertising fraud affects both marketers and networks alike. While the media like to focus on the challenges advertisers face in dealing with mobile fraud, the reality is that networks often get squeezed the hardest. Because networks typically have to pay publishers for traffic before advertisers are billed, networks end up holding the bag on losses from fraud.
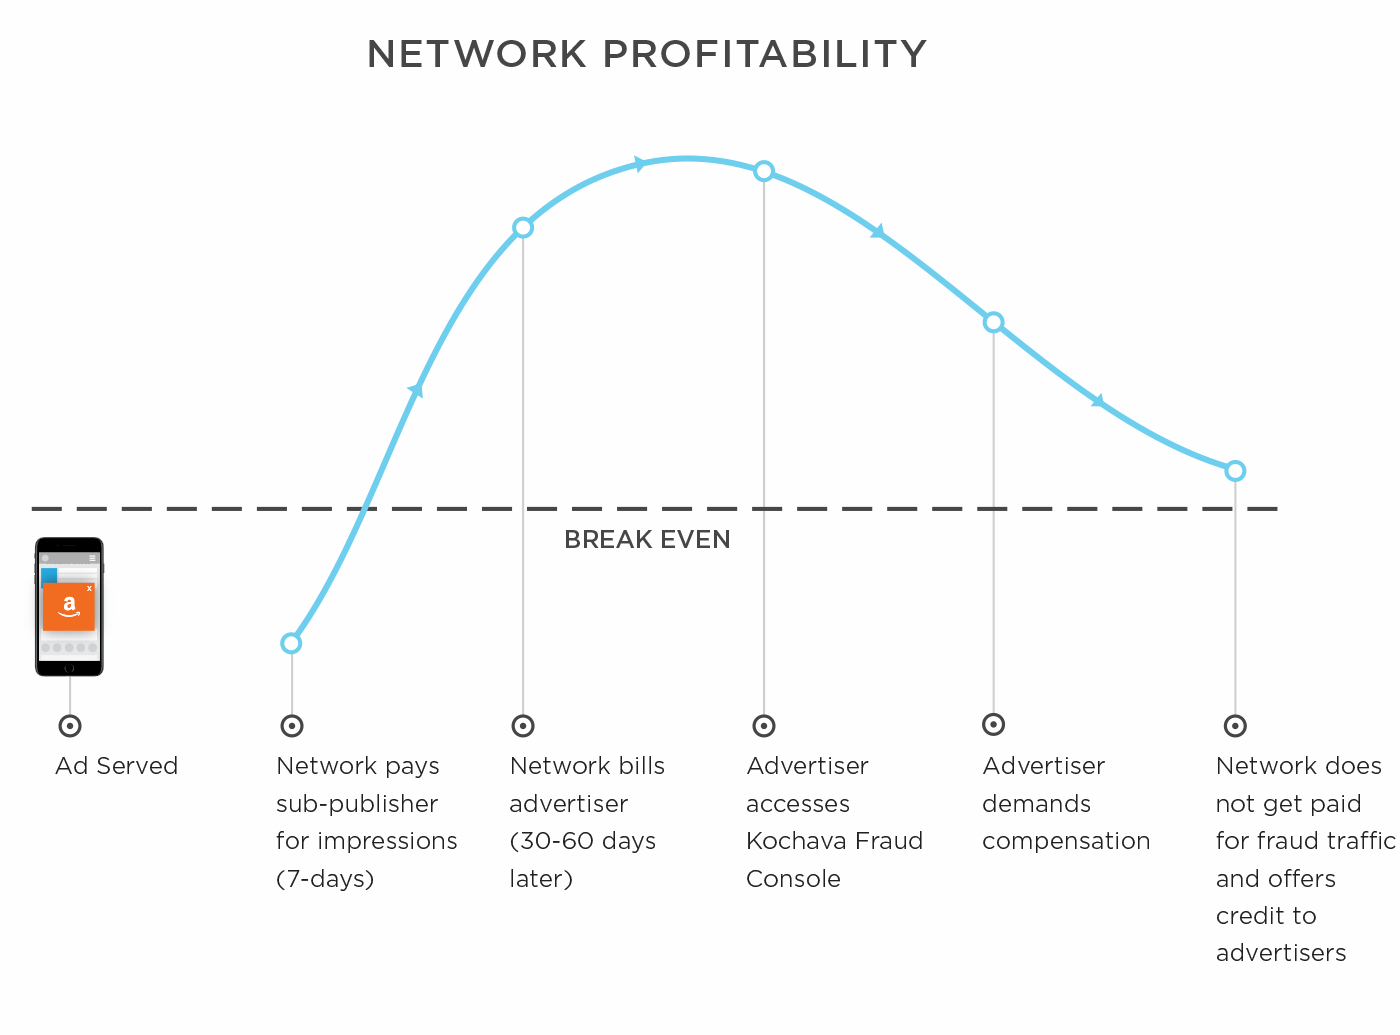
By the time advertisers reconcile the cost of their traffic against any fraud they detected during the campaign, networks have already paid for said traffic. Thus, networks are not only blindsided by reports of fraud but also stuck offering credit to advertisers for the fraudulent traffic they already paid for.
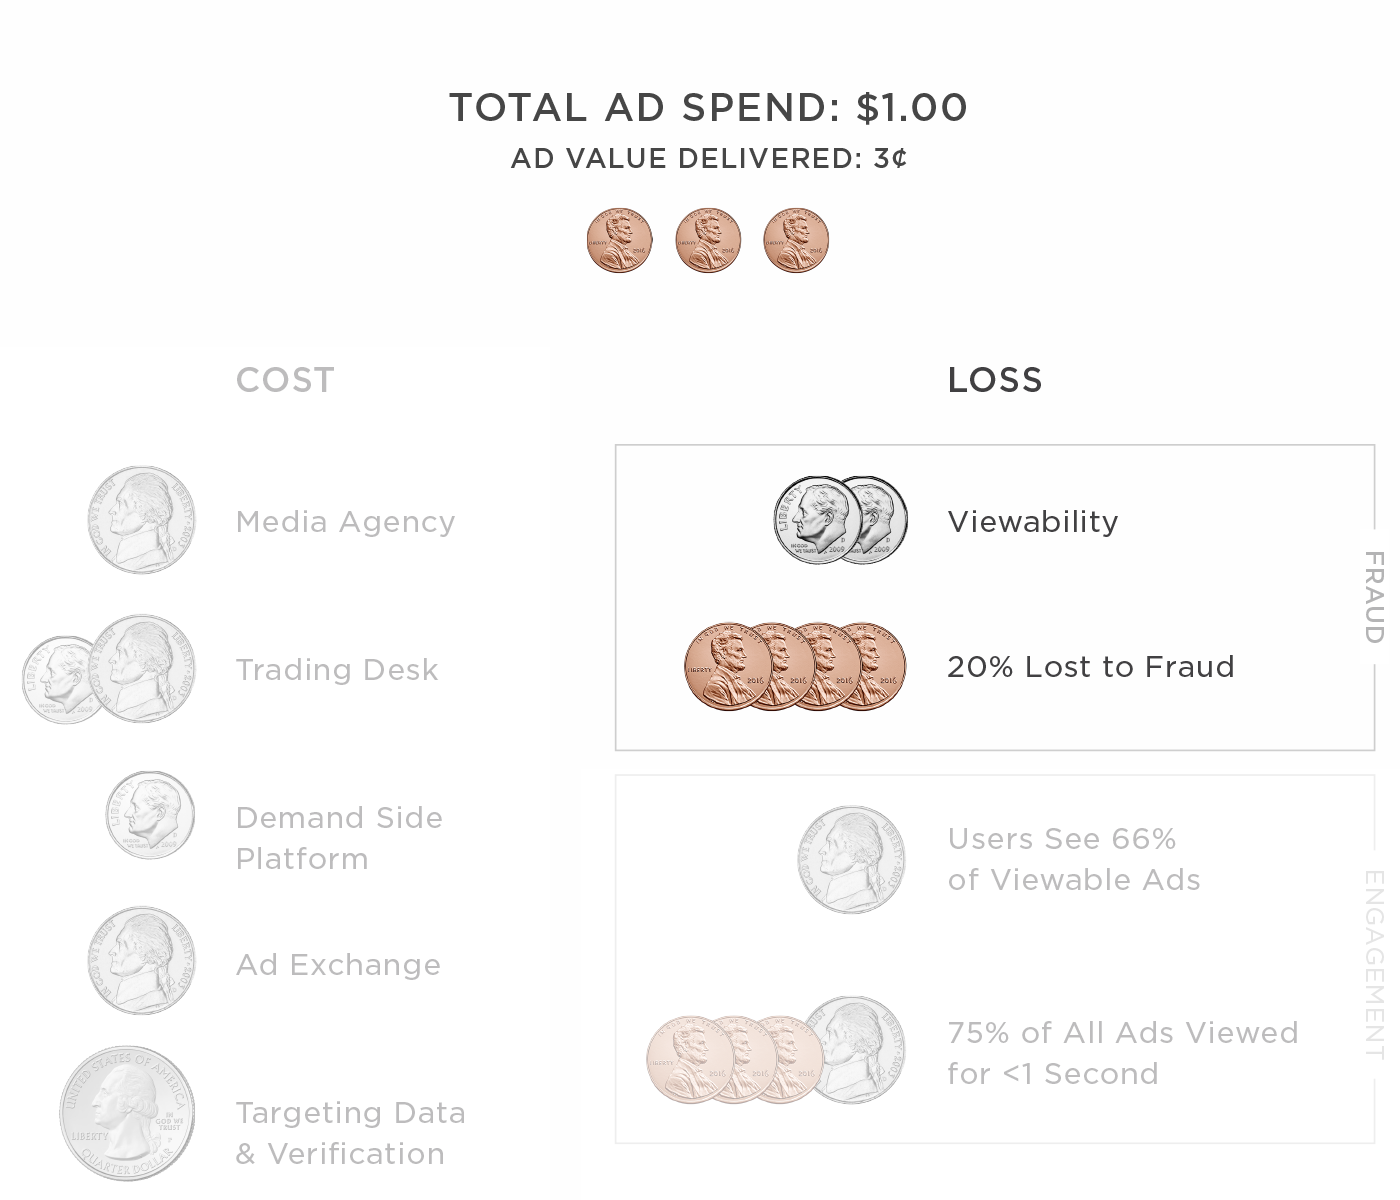
Fraud also eats into network profits. Out of the total ad spend, fraud diminishes the ad value for a campaign as well as a network’s credibility to advertisers. The competition for networks is already tough, as they compete with media agencies, trading desks, DSPs, ad exchanges and other service providers for market share.
Break a vicious cycle
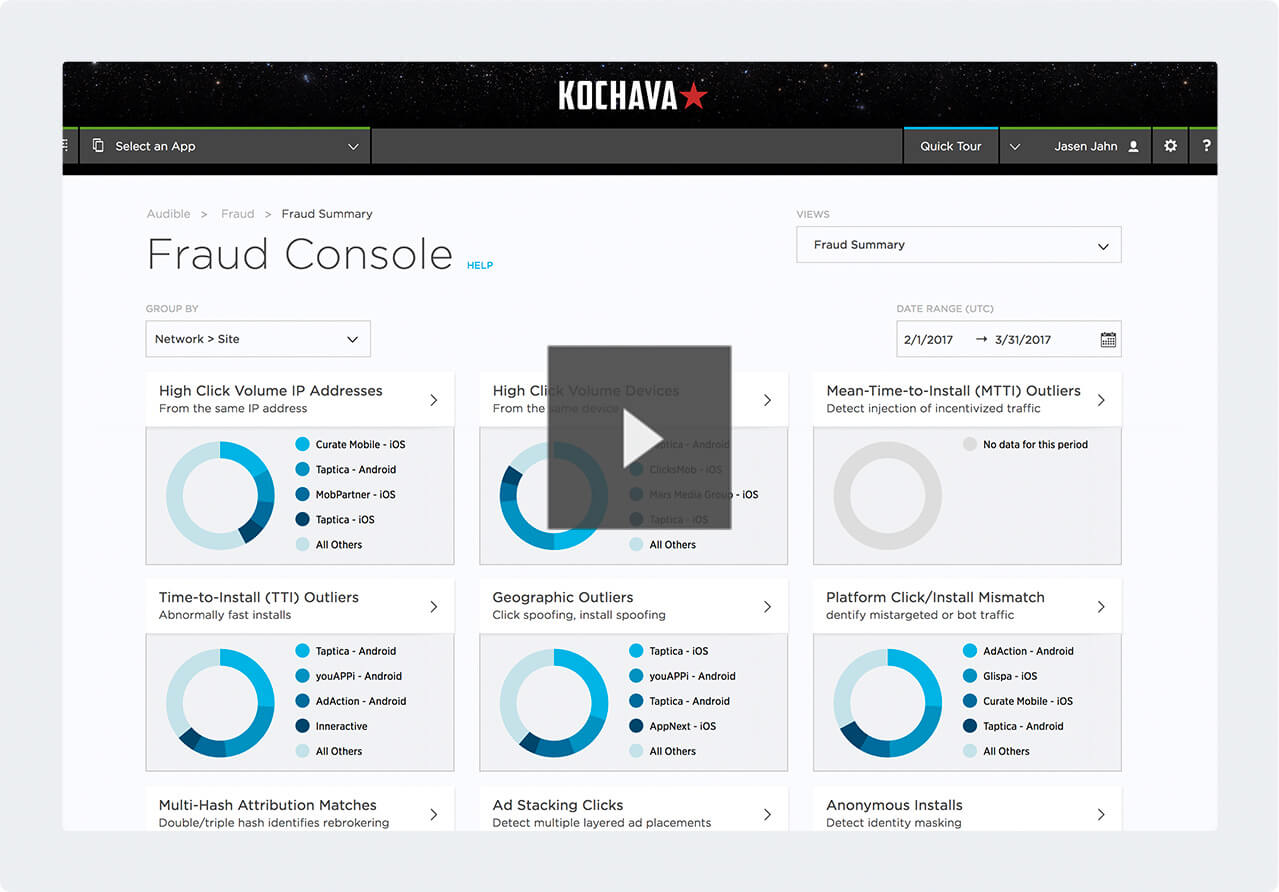
The Kochava Fraud Console for Networks provides industry-leading fraud abatement tools, allowing networks to identify fraud before the advertiser does, and detect fraudulent traffic before paying sub-publishers for it.
The visualizations show both obvious fraud and data anomalies, flagged for review. By using the Fraud Console, networks show their credibility in doing their part to uphold ethical industry standards. Preventing fraud means saving revenue and time spent negotiating amends after the campaign.
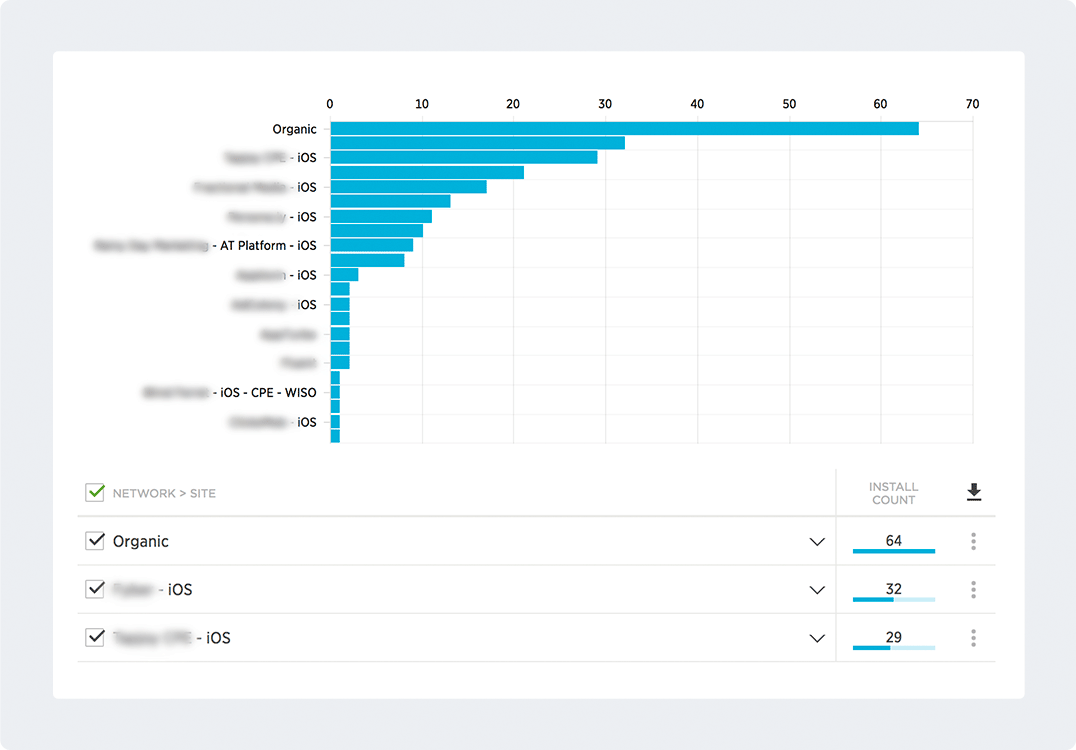
Data visualizations of statistical outliers
The console includes 12 reports that leverage statistical methodologies and pattern identification to flag all identifiable fraudulent tactics present in the ecosystem.
Learn How We Combat Fraud
Request a Free DemoDownload the Free eBook1. High Click Volume IP Addresses
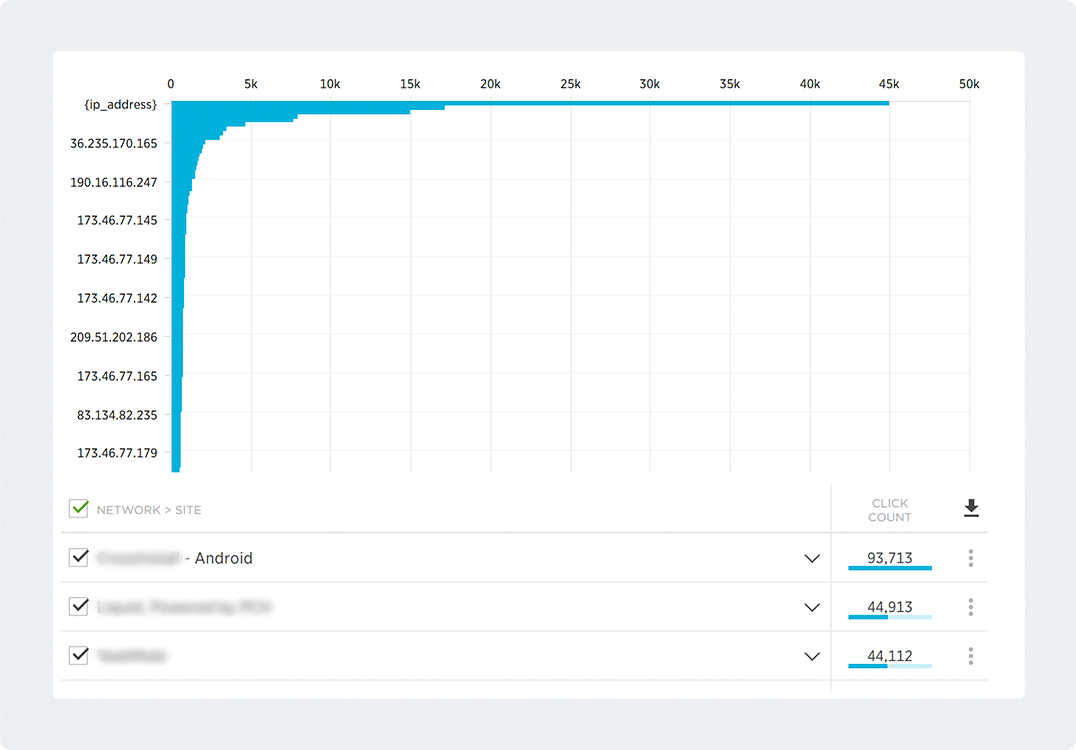
Many customers currently focus on install rates, but high click volumes for IP addresses obscure campaign outcomes. Abnormally high click-to-install ratios raise a flag that fraud may be present. This can also be a leading indicator of issues with server-to-server click feeds. Either way, there is a problem to be solved.
2. High Click Volume Devices
A high volume of clicks from a single device is not typical user behavior and is a strong indicator of click injections from bots or hijacked devices. As with IP addresses with large click volumes, Kochava identifies these device IDs for abatement.
3. Mean-time-to-install (MTTI) Outliers
MTTI is the average time between the click and install and varies by app and network. For example, map apps have a very low MTTI—users download when they need to get somewhere. Games tend to have a higher MTTI—users download with the intention of playing, but it may take days before they launch the app. When MTTI varies greatly for a specific source—either too short or long—this indicates that something is askew.
4. Geographic Click / Install Delta
The vast majority of installs happen within close proximity to the attributed click. Kochava identifies statistically significant variances between the location of the click and that of the install. These variances may be indicators for fraud.
5. Time-to-install (TTI) Outliers
Time to install (TTI) is an important indicator of install validity. The time between click and install depends on physical factors (network speed, size of app binary, etc.) and behavioral ones (incentivized installs typically happen within a short time). Determine the mean TTI for your app on a given network and sub-publisher as a baseline from which to measure. The TTI Outliers view indicates potentially fraudulent traffic based on the baseline TTI and shows abnormally fast installs.
6. Platform Click / Install Mismatch
When ads are repeatedly served to the wrong platform, there’s a problem. If ads for an iOS app are generating clicks on non-iOS devices, this may indicate that bot farms are generating fraudulent traffic. It may also show poorly targeted traffic.
7. Ad Stacking Clicks
This tactic is one of the easier forms of fraud to detect at the network/site level. This report indicates when multiple ads were clicked at the same time from the same device. Multiple timestamps strongly suggests click/impression stuffing or viewability fraud.
8. Anonymous Installs
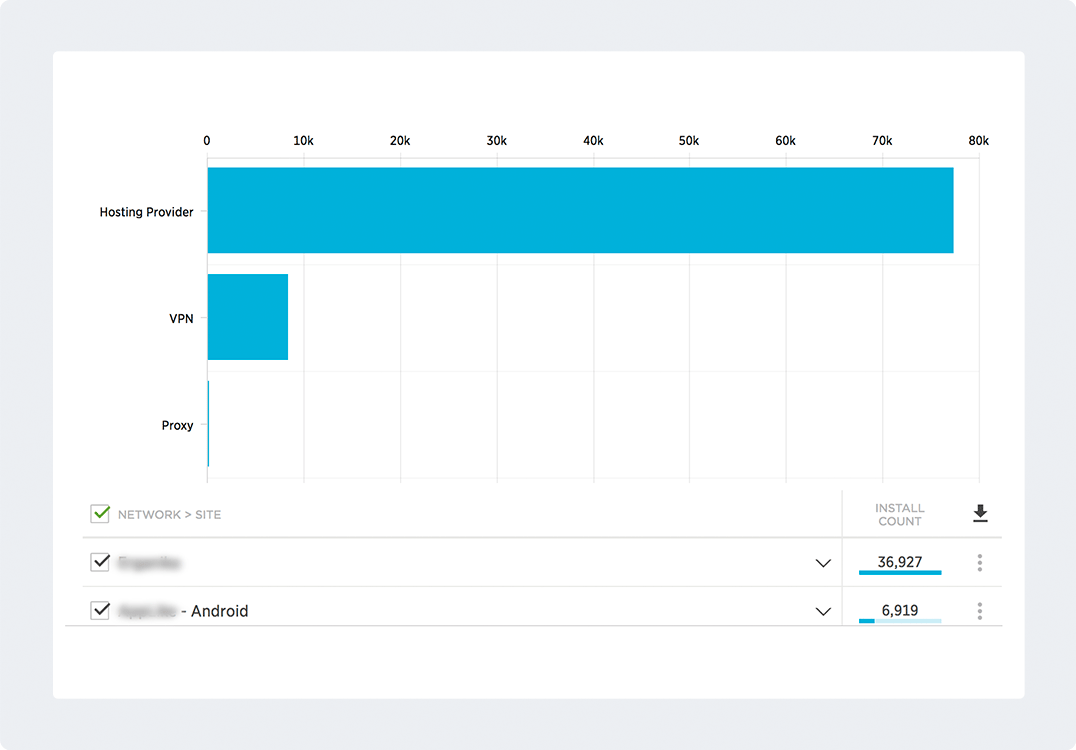
If sites use anonymous proxies, VPNs and TOR exit nodes to hide their identity, Kochava blocklists them. Transactions should be transparent and a site taking measures to hide its identity is not trustworthy.
9. Non-Verified Install Receipts
For installs originating from the iTunes Store, Kochava receives an install receipt that can be independently verified. In cases where the installs are not able to be verified, Kochava surfaces these as fraudulent.
10. Non-Verified Purchase Receipts
Kochava receives purchase receipts for both iOS and Android purchases. Kochava validates these purchases against their respective store servers. Similar to Install Receipt verification Kochava surfaces unverifiable purchases as fraudulent.
11. Click Flooding
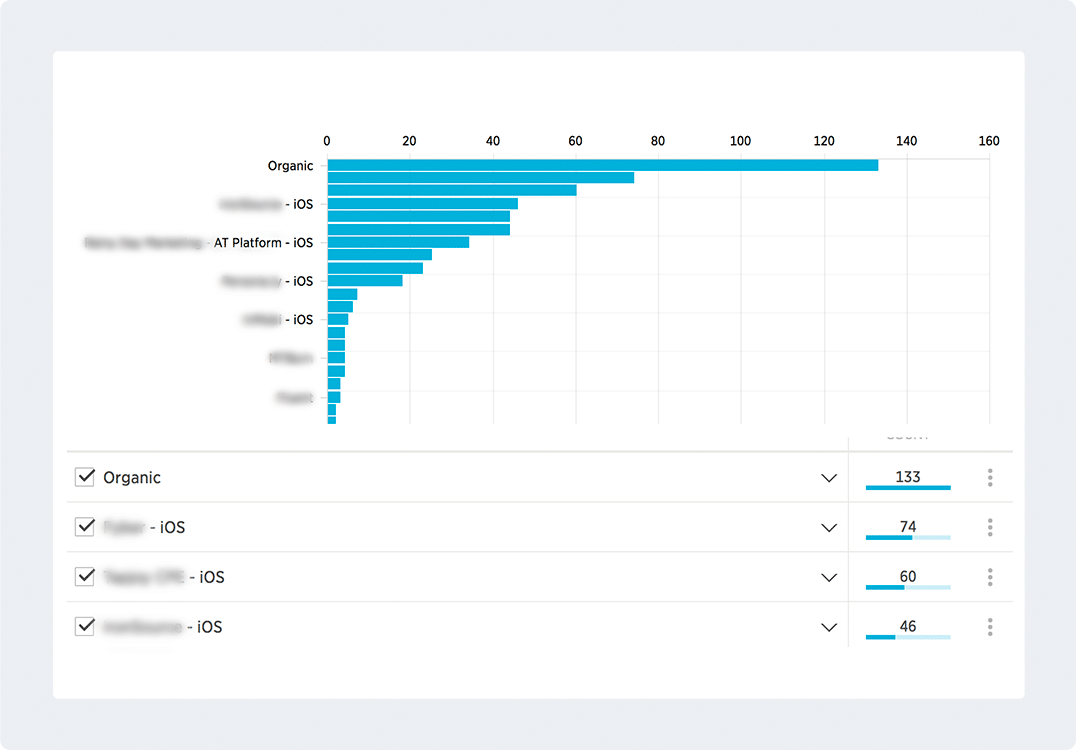
This type of mobile ad fraud occurs when a network or sub-publisher floods its channels with clicks until a user installs. Because of the frequency of clicks, the network/sub-publisher illegitimately receives attribution. This type of fraud is detected when clicks outnumber campaign installs. The view shows those networks and sub-publishers with an unusually high click-to-install ratio.
12. TTI Distribution
For most campaigns, the majority of installs occur within the first few days of launch and then trail off as the campaign continues. The TTI Distribution view shows the number of installs that occurred within a five-day window of the click or impression and also outside of it. This visualization highlights cases where there is an increase in installs with time, which is typically considered abnormal behavior.
Fraud Abatement Series
Grant Simmons is Director of Client Analytics at Kochava. He is our resident expert on mobile ad fraud detection, and leads his team in analyzing campaign performance and business value assessments. Below is an in-depth series by him explaining the major types of fraud.
Part 1: Detecting Fraud by Counting Clicks
If marketers only focus on install rates, they’re missing the action behind the scenes. Fraudsters can employ a number of tactics to win attribution, resulting in an exorbitant number of clicks per install and wasted ad spend. Read More.
Part 2: Devices With High Click Volumes and Fraudulent Traffic
Devices that output a high number of clicks are likely the product of a bot or hijacked device. The fraud report for this tactic flags abnormally high click volumes, but marketers should also have their own baselines for acceptable volumes. Read More.
Part 3: The Fraud Behind Install Metrics
The time from click to install varies according to a campaign. However, abnormal patterns require further investigation. Differences in MTTI and TTI may show evidence of unwanted incentivized traffic or are indicative of poorer quality users. Read More.
Part 4: Ad Stacking
Ad stacking is a fraud technique where multiple ads are layered on top of each other in a single ad placement – with only the top ad being visible. If a user clicks on the visible ad, a click is registered for all ads in the stack. Read More.
Part 5: The Global Fraud Blocklist
The Global Fraud Blocklist acts as a firewall for campaign traffic. It is a dynamic list comprised of known fraudulent device IDs, IP addresses and network/site IDs. These are entities that are repeat offenders of fraudulent activity or exceed established thresholds outside of normal activity. Read More.
Kochava CEO, Charles Manning, wrote about how Kochava is handling fraud abatement, at scale.
Director of Client Analytics, Grant Simmons, wrote a whole series on Kochava fraud detection and abatement.