Today’s marketer is data-driven. More than simply connecting our clients with their data, Kochava seeks to empower strategic decisions through marketing intelligence. Our growing Client Analytics team is comprised of data analysts that work hand-in-hand with clients, delivering face-to-face business value assessments (BVAs) and quarterly business reviews (QBRs) that inform, educate and empower UA managers, CMOs and other decision makers to position their brands for success.
In this series, members of our Client Analytics team will explore marketing intelligence insights available to our customers from the tools Kochava provides.

Go for unique traffic
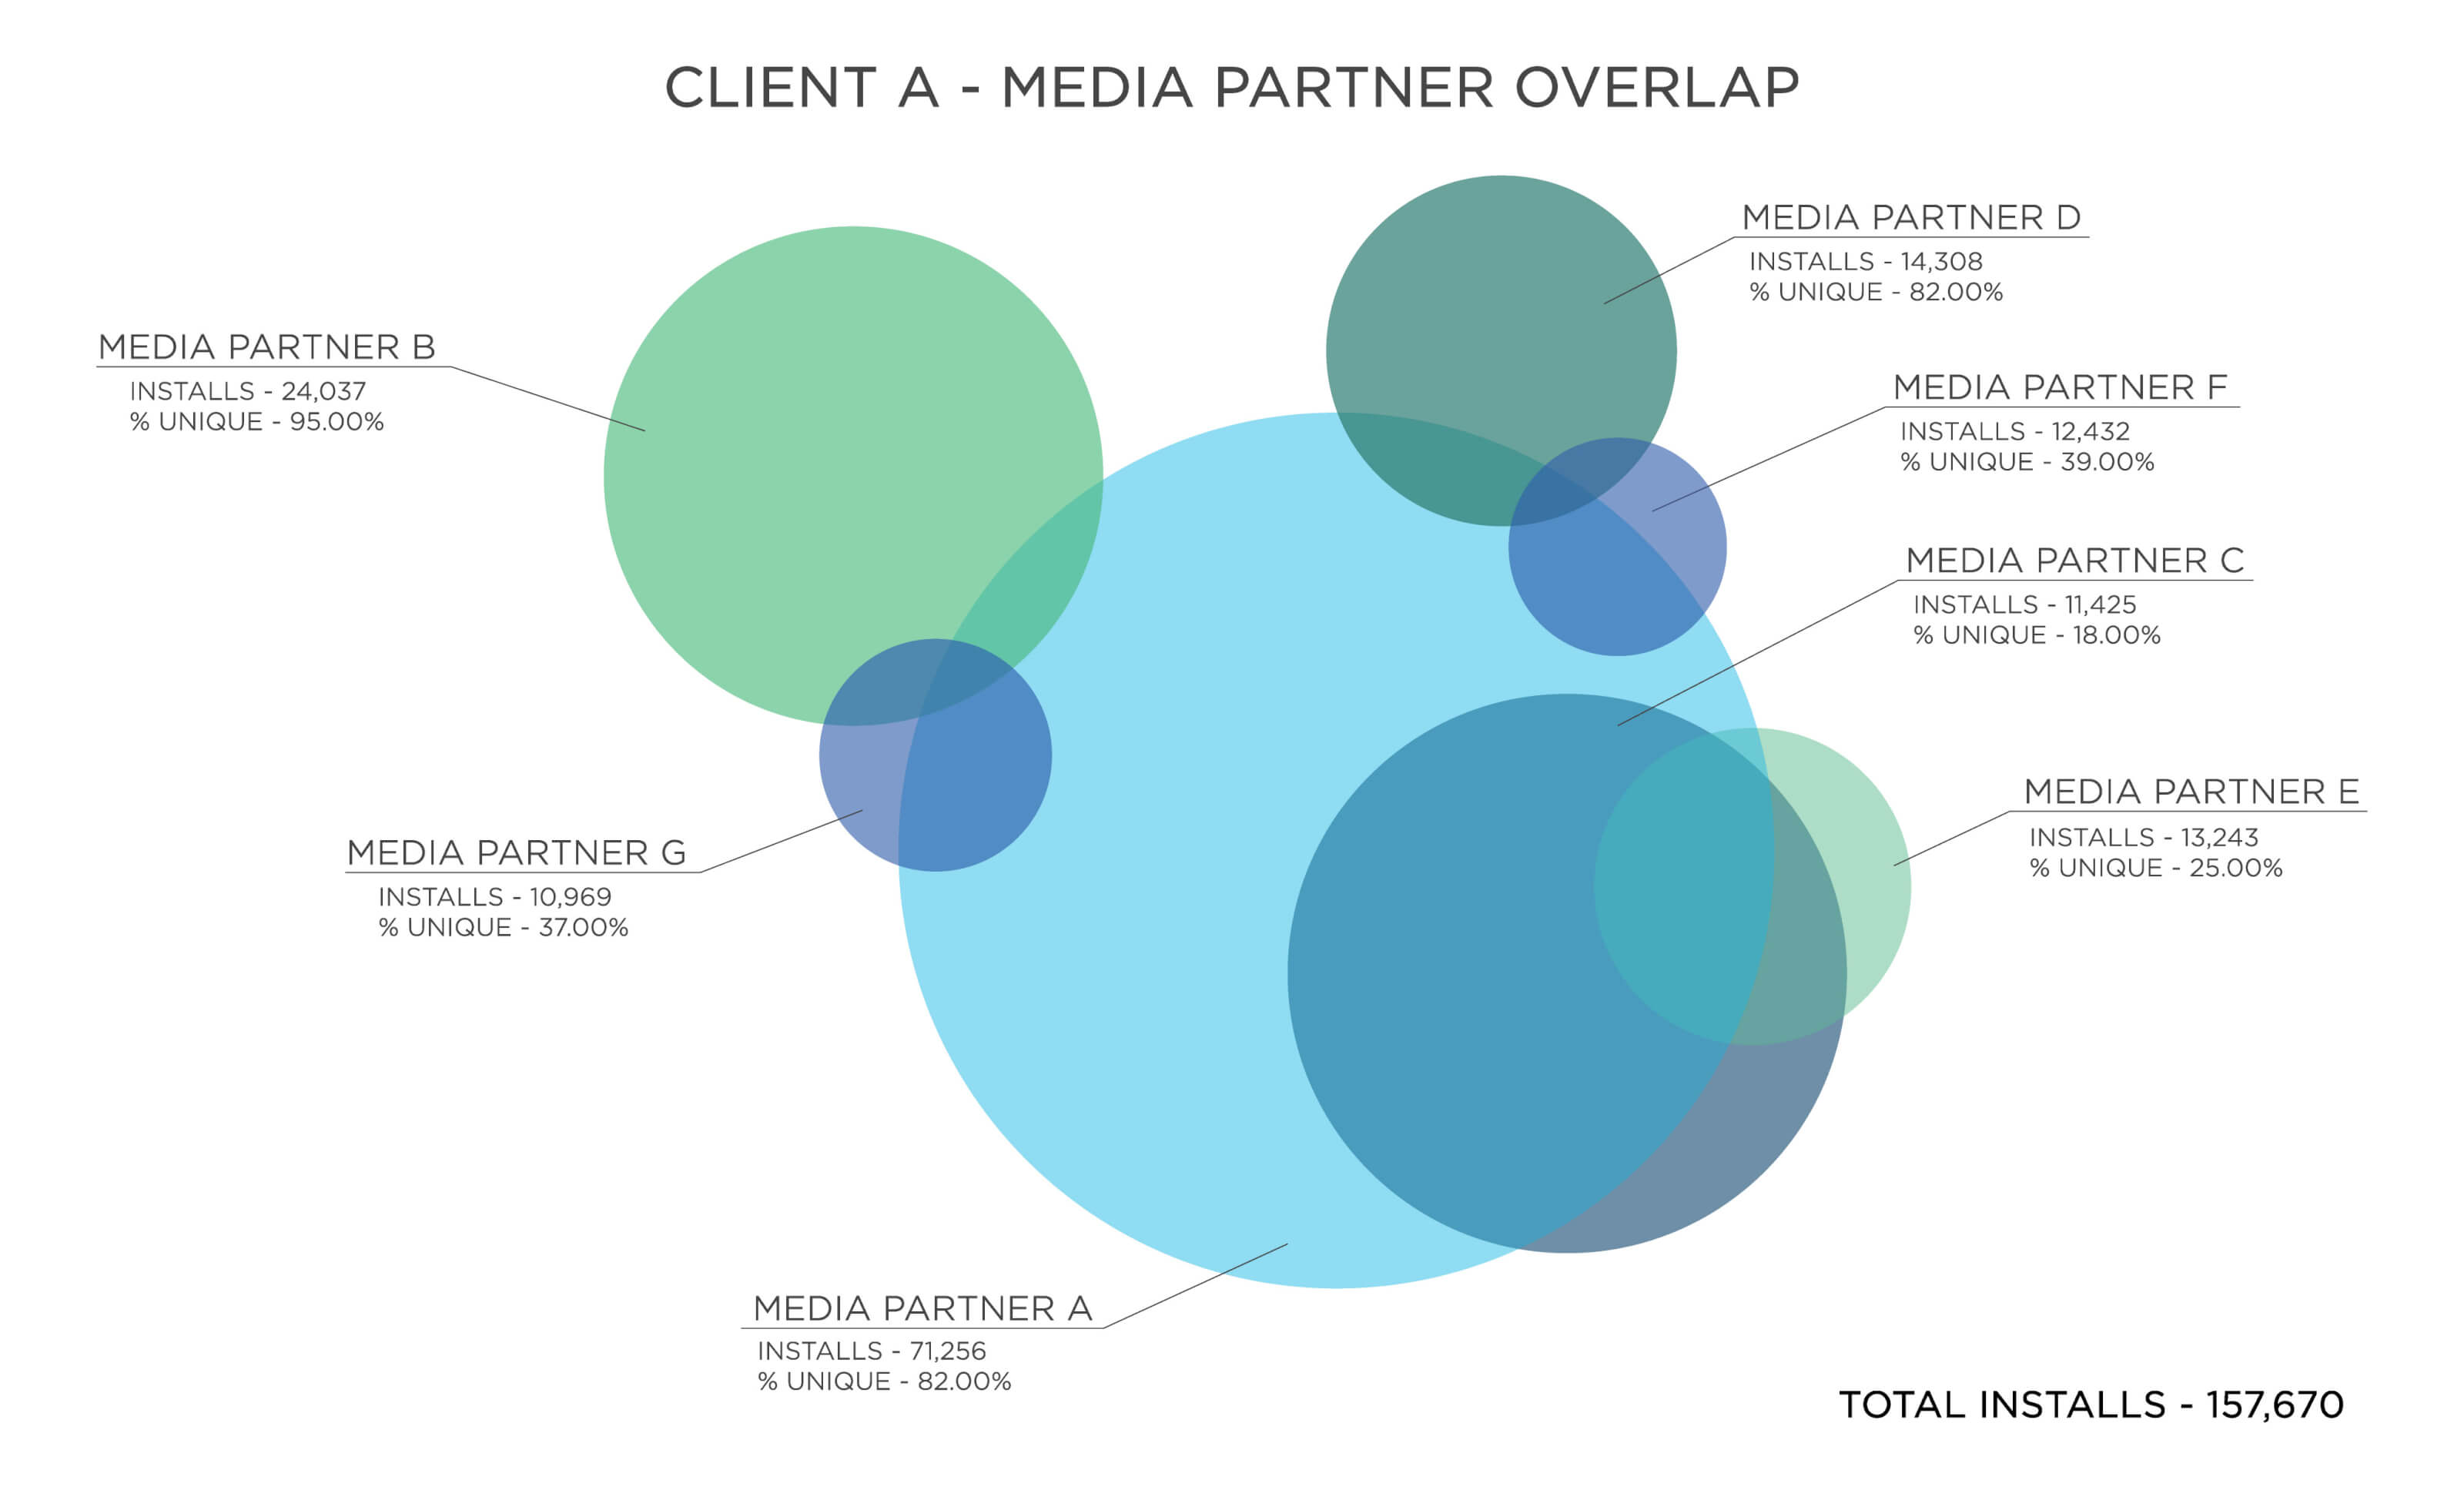
Here’s food for thought—how many of a partner’s installs are unique vs. influenced? In essence, does a media partner have unique reach, or are they stepping over the toes of another partner and bidding against each other for the same placements? With multi-touch attribution, Kochava can show the path a user took across multiple impressions and clicks to finally reach the point of conversion.
Not only can Kochava show you influencers that overlap across partners, but we can also give insight into self-influencers, or partners who repeatedly hit the same user again and again. Too many self-influencers from the same partner or DSP may suggest poor frequency capping, translating to a bad user experience. When two partners have significant influencer overlap, offering minimal uniqueness in reach, the marketer should consider trimming one of those partners. Ideally, you want unique traffic, with partners delivering valuable users that no other partner could have delivered.
Improve quality
Further insights can be gained by adding a qualitative layer that assesses performance by downstream completion of key performance indicators (KPIs). Kochava offers flexibility to customize and refine the analysis against vertical-specific KPIs, such as: free trial starts for a video streaming app, first, second and/or third order placements for a QSR app, and level completes or gameplay for gaming. Whether it’s a single KPI action or a combination/sequence of multiple KPIs, the time window within which these activities must be completed can also be refined.
Combining the influencer layer with the qualitative layer can offer a unique intersection of insights. For instance, compare the quality of the unique vs. influenced installs. Here, “quality” would mean installs with the completion of KPIs downstream within the optimal time frame. Ideally, you want to see higher quality for your unique traffic than your heavily-influenced traffic. That being said, in certain cases, trends may show that the combination of two or more partners influencing a user consistently results in higher downstream engagement with KPIs. This may suggest that the confluence of these media partners and/or the combination of marketing channels they traverse delivers a winning combo for engaging quality users.
Also, compare the percentage of unique traffic for all attributed media partners to the average unique traffic for the app. Make note of media partners with a below-average percentage of unique installs and look deeper into these media partners. Kochava can even decomp performance and quality at a much more granular level, such as by site or creative ID.
Unattributed (a.k.a. organic) traffic also offers a helpful quality baseline. Organic users are those who seek out and install an app on their own, without clicking on any ads. They often index higher on downstream performance and engagement with the app. Measuring paid media partners against organic quality trends allows you to see those under- or over-indexing on quality. Consider trimming partners that significantly underperform. At the same time, be watchful of partners that consistently parallel organic trend lines, as this may be a proxy for clever organic sniping tactics. Implementation of fraud tools to prevent click flooding and click injection will help mitigate organic sniping.
Use case
A gaming company ran ads with 10 media partners during April 2019, and they want to understand the uniqueness and quality of the installs driven by each partner to determine if there are opportunities to cut/expand marketing budgets next year. “Purchase” is their key KPI and they typically see purchases happen within seven days of the install so they want to see what percentage of installers had a purchase within seven days of the install.
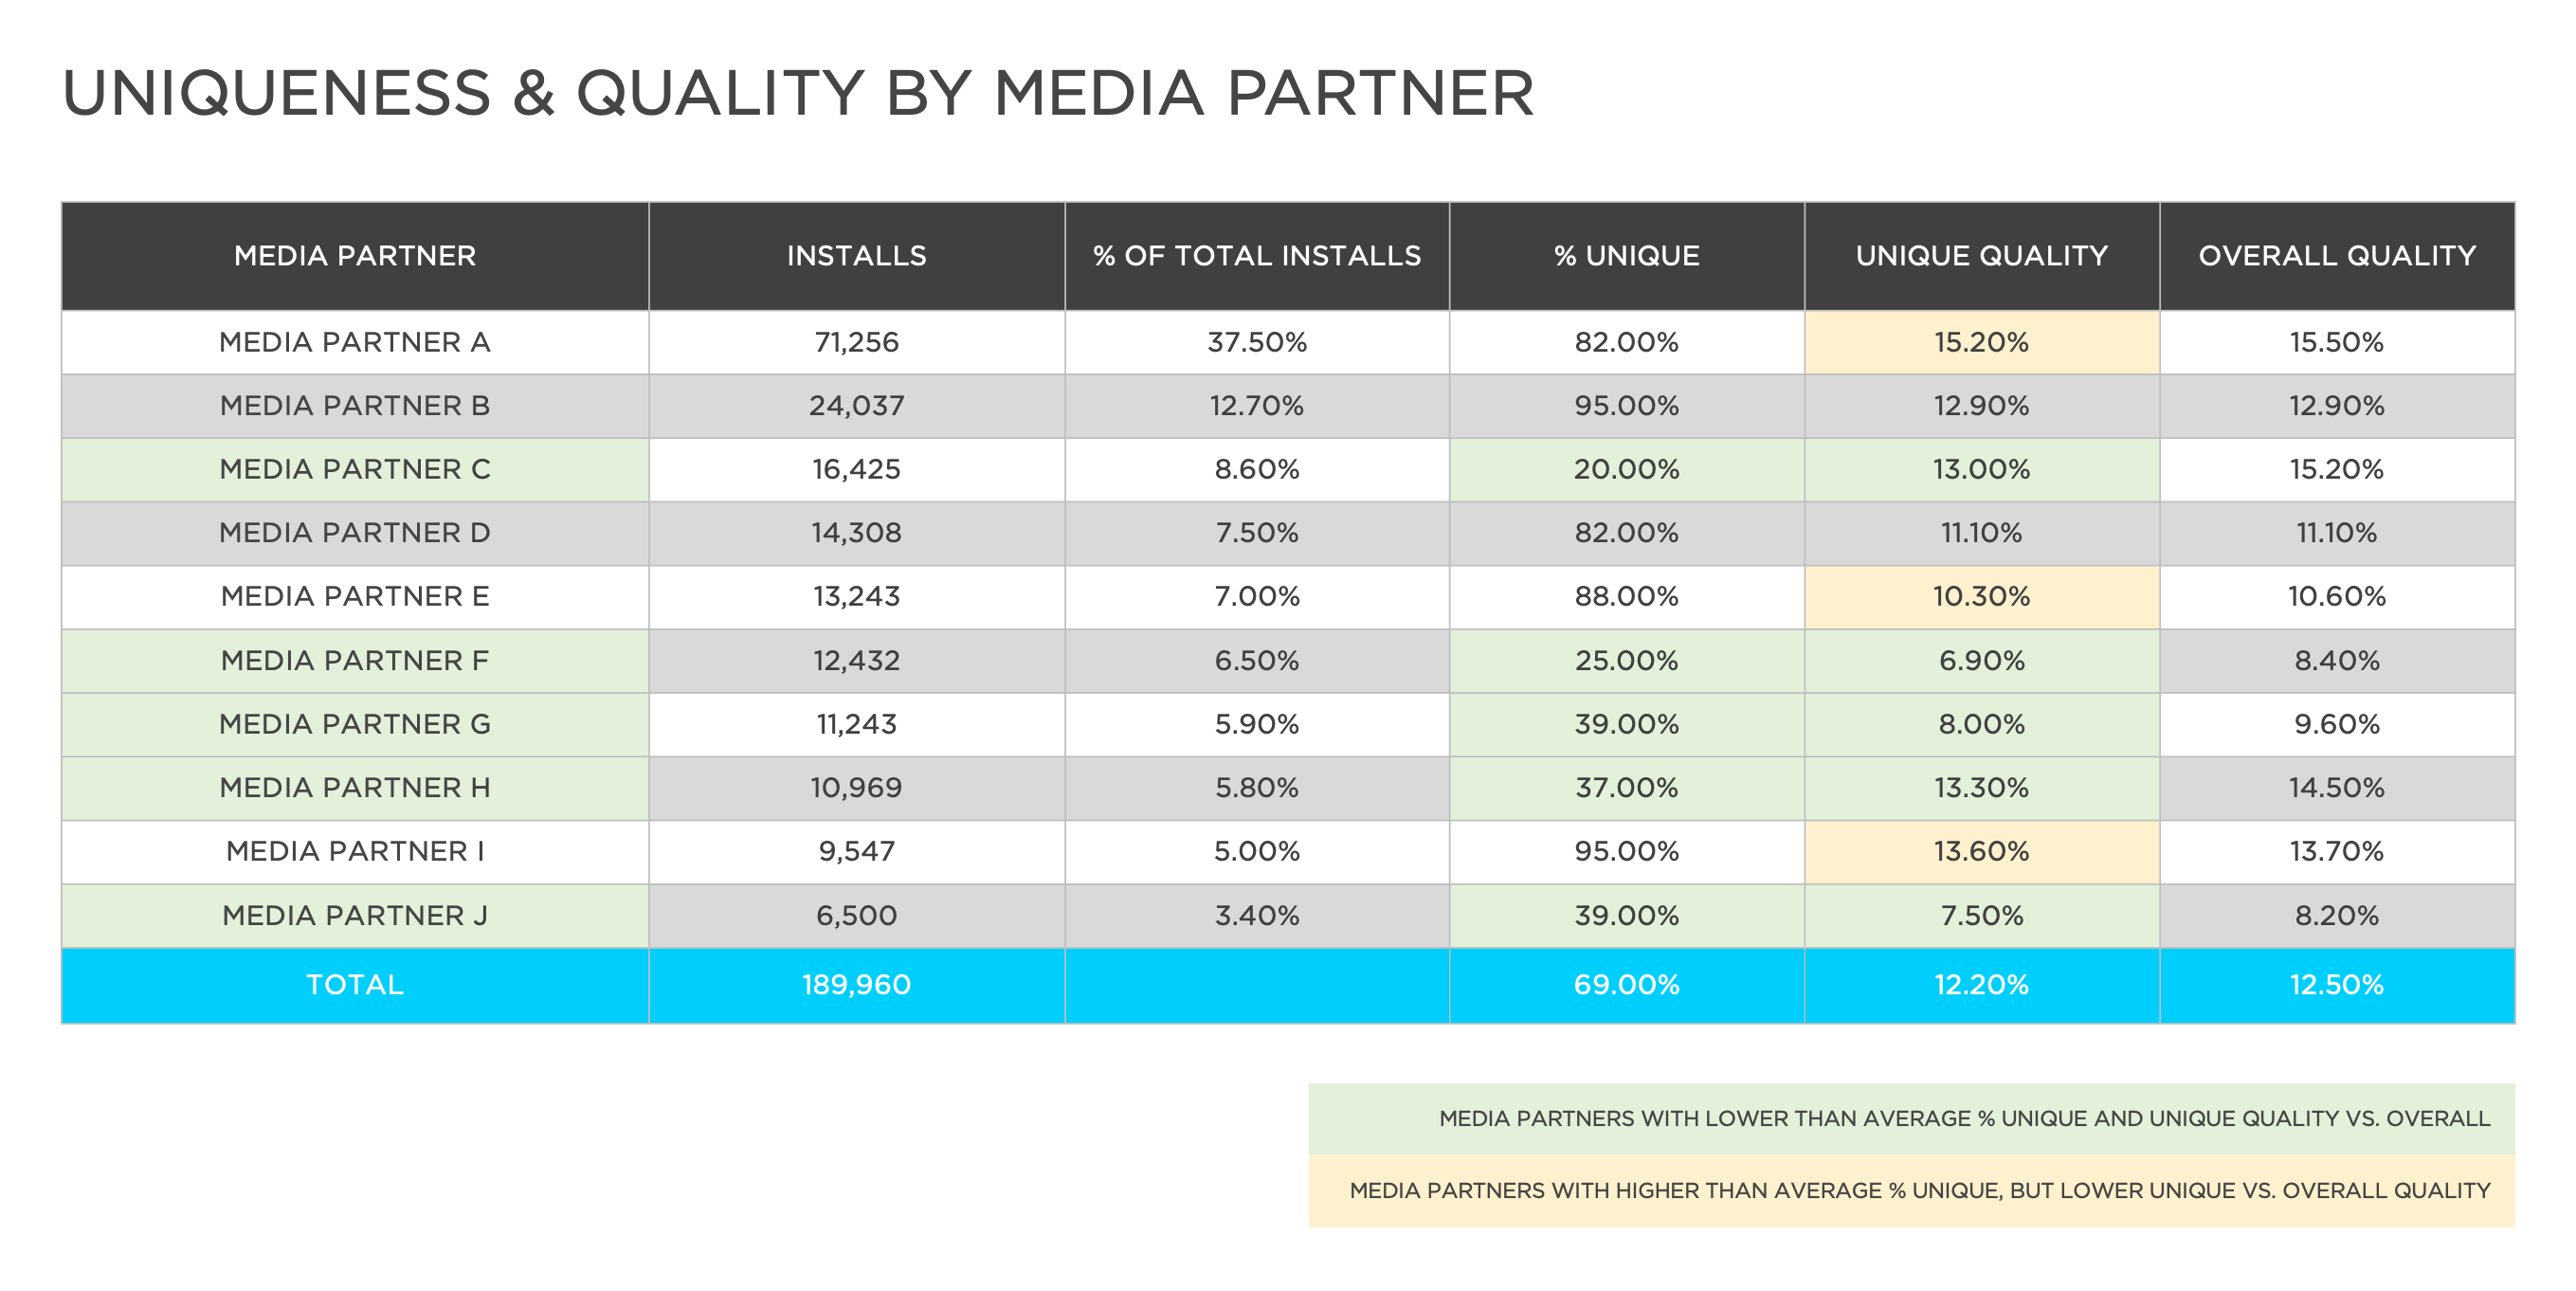
The Uniqueness & Quality By Media Partner chart below shows the results of the analysis that the gaming company completed. After running this analysis they compare which media partners had unique and quality installs and determine that five of the 10 media partners they are running media with have lower than the overall average of 69% unique and also have unique quality that is lower than the overall quality.
The client decides to dive into the five media partners (media partners C, F, G, H, and J from the below chart) that had a very small amount of unique installs and those unique installs had lower quality than overall quality as a first step. After looking deeper at the traffic these media partners provided and the cost associated, the gaming company decides to cut back dollars put toward these media partners and invest deeper into higher quality unique sources. By cutting back dollars put toward these media partners, they can become more efficient with how they spend their marketing dollars to drive more high-quality, unique installs.
Here is an example of the results used to make their media partner cuts:
 The takeaway
We typically recommend that marketers focus on the quality of a media partner’s unique traffic—all else being equal—those are the installs that the marketer would not have received without the partner in question.
In the table above, we see that media partner F was only 25% unique—meaning three-fourths of their installs would have attributed to other partners if partner F wasn’t in the mix. And, the influenced installs were of higher quality than what the partner uniquely touched. Overall, partner F is not contributing to better installs.
There are a number of ways to optimize your ad spend, and thoroughly evaluating your media partners is an important part. Contact Kochava to learn how you can leverage our turnkey partner analysis methods to see which partners are delivering unique, high-quality users.
On the lookout for your next media partner? Download the latest Kochava Traffic Index to see the top 20 ranked partners for Q1 2019.
Ready to start looking into your media partner mix? Contact your client success manager or support@kochava.com. With Kochava, you have a support team at the ready to meet your needs.
Not a Kochava customer? Contact Us Today.

 The takeaway


