In an effort to continue to bring marketers the best tools, Kochava will be publishing a series of partner posts. The following post on multivariate creative optimization was composed by Aarki and is the first in a set of 6 partner posts we’ll be sharing over the next 6 weeks.
Aarki is a Kochava-certified network. Click here to learn how to create an install campaign or reengagement campaign within Kochava.
For a long time, creative has been the holy grail of advertising. Something that is a pure art and cannot be quantified or optimized. Even with the proliferation of digital media and cheap computational power, optimization was something that was done after the ad creative was finalized. But this basic premise is being increasingly challenged.
At Aarki, our data scientists are constantly trying to find innovative ways to improve ad performance. Over the past five years, they have developed several industry leading technologies to deliver greater value to mobile app marketers. These technologies have been used on 120,000+ campaigns to serve almost 14 billion impressions.
In this article we share the results of a robust statistical evaluation of the performance of one such technology — multivariate creative optimization.
Sample Data
The data for this analysis is based on a random sample consisting of 381 distinct campaigns that were run by Aarki during the past six months. To protect the identities of our clients, we don’t share any campaign-specific data in this article. These campaigns represent a diverse mix consisting of both game and nongame mobile apps, campaigns of different budget sizes, and across a wide geographical area. In this sense, they are representative of Aarki’s client base.
Analysis Methodology
Data was initially manipulated in PostgreSQL and then analyzed in R. The primary objective of the analysis was to evaluate the incremental performance improvement delivered by multivariate optimization of the ad creative. For the purpose of the analysis, the first creative combination was assumed to be the baseline and performance of subsequent creative combinations was analyzed in relation to the baseline combination. Performance of each combination was quantified by dividing the total media cost by the number of users acquired, i.e., cost per install (CPI).
Results: Overall CPI Improvement
The analysis indicates an average CPI improvement of 41.2% as a result of multivariate creative optimization compared to the baseline creative. Results of a Student’s t-test (shown in Table 1) validate this finding to a 99.99%+ confidence with a t-statistic of 6.28. Given that in every case the baseline creative was developed using current ad design best practices, this is a very compelling finding.
Table 1: Results of a Student’s t-test on CPI Improvement
Results: Key Drivers of CPI Improvement
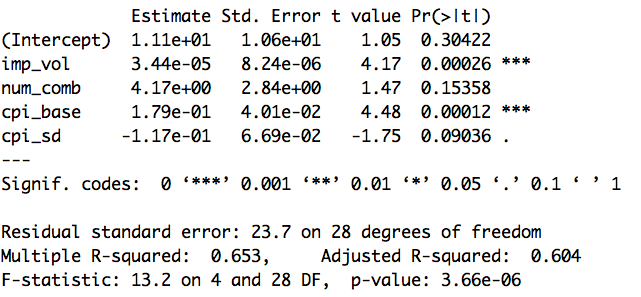
To further understand the main drivers of CPI improvement, we conducted a stepwise generalized least squares analysis on the dependent variable. Results of this analysis are shown in Table 2.
Table 2: Generalized Least Squares Model of the Drivers of CPI Improvement
The model has an overall adjusted R-squared value of 0.604, which represents a fairly decent goodness of fit. It suggests that the four drivers identified in the model are able explain the changes in CPI to a high degree, even within the assumptions of a parametric linear construct and error normality. Since the objective of this analysis was to understand the tendencies and significance of the drivers, and not to build a predictive model, we did not attemp at alternate modeling formulations.
Examining the t-statistics of the four explanatory variables indicates that all of them are significant at the 85% confidence interval.
The biggest drivers of CPI improvement are imp_vol (total volume of impressions served) and cpi_base (CPI of the baseline creative). This suggests that Aarki’s multivariate creative optimization works and is able to deliver progressively higher improvements in performance as more and more impressions are served. And the higher the baseline CPI, the greater the potential for performance improvement. The number of creative combinations tested is important but not as critical in driving improvements as the other two variables.
Variability in the CPI is also an important factor. Our analysis indicates that the more the CPI varies across a campaign, the lower the likelihood of achieving greater performance improvements. This is an important insight. It proves the stability of our optimization algorithm and suggests that performance variability is likely due to exogenous factors outside the control of the campaign team. This implies that a consistent media strategy often delivers better results than one that varies a lot.
Summary
In this article, we have presented the results of a robust statistical analysis of the role of Aarki’s multivariate creative optimization algorithms in driving campaign performance. The analysis indicates that Aarki’s technology delivers significant performance improvements, provided the campaign has a robust impression volume and there is consistency in the media strategy.
Aarki is a Kochava-certified network. Click here to learn how to create an install campaign or reengagement campaign within Kochava.


