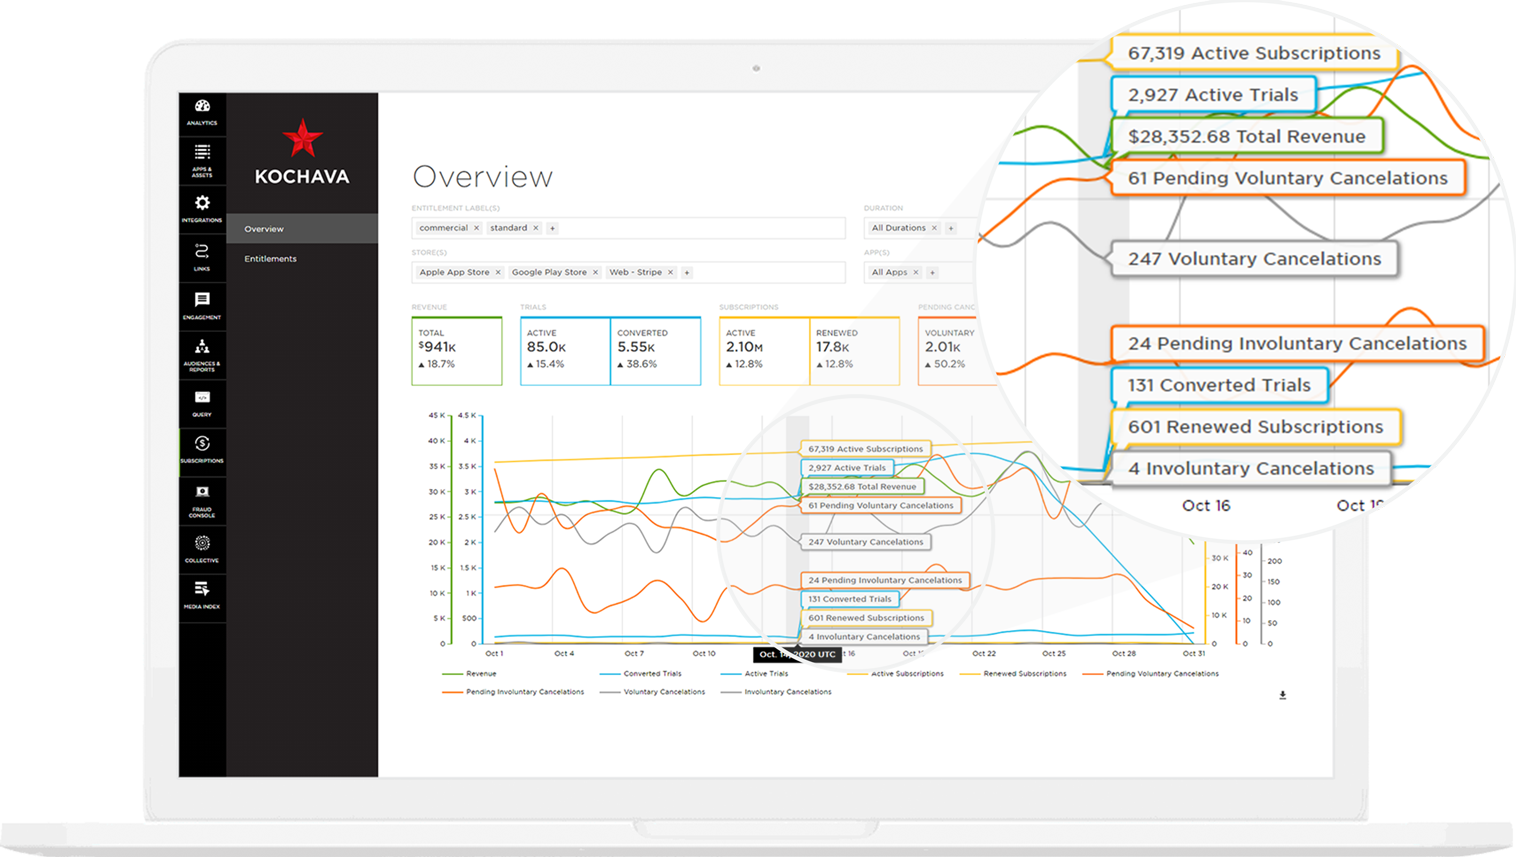
Kochava Subscriptions collects subscription data in one place, eliminating the need for marketers to collect and organize it themselves.
The subscription app revenue model is ideal, and it has exploded in the past year. It’s no surprise that there was a record number of app downloads in 2020, with subscription apps like Spotify, Pandora, Netflix, and Tinder, leading in several market categories. Subscriptions, in particular, had been increasing and expanded even more when people began staying at home last year.
With subscription apps, marketers can count on a dedicated monthly revenue stream, and users get access to the content without in-app consumable purchases. However, managing and measuring subscription apps is a beast of its own and goes beyond measuring subscription events such as a trial that started or a subscription signup. That’s why we created Kochava Subscriptions to give marketers detailed insights about their subscribers.
A 360-degree view of subscription apps
If you’ve got the right content—gaming, streaming media, utilities—anything with regularly updated content, the subscription revenue model can help secure a healthy customer following and revenue. But while the model may be ideal for some marketers, it’s a whole other job to manage one.
Without a full management system, marketers will spend most of their time collecting and organizing data to measure key performance indicators (KPIs) and create reports. Without proper integration into the app stores and payment processors, it’s difficult to calculate finances, and with that any forecasting too. Most marketers are doing the work of two people and are tied up trying to understand app activity and performance with little time left to focus on growth.
Previously, subscription measurement involved following events, such as Trial Started or Login, that provide limited insight about app activity and retention. But Kochava Subscriptions goes beyond event measurement. With it you get in-depth, row-level data, predicted revenue and recovery data, predicted churn scores, and the ability to integrate CRMs for data enrichment. Marketers can easily answer questions such as: How many distinct subscriber households do I have as opposed to a raw count of subscriptions? How many of those are at risk for attrition or cancelation? What is the revenue from each app store and how can I forecast revenue?

The Overview analytics page within the Subscriptions dashboard provides a visualization of key performance metrics related to revenue, trials, active subscriptions, pending cancellations (both voluntary and involuntary), and more. Marketers can filter the data by app, payment processor, entitlement groupings, subscription length and other variables to extract the insights they need.
Need to provide a quarterly revenue report with forecasting? The “At a Glance” view shows your revenue and can be segmented by app, payment store, billing duration, or each individual subscription offering. Obtain forecast numbers by seeing how many customers are up for renewal by the exact date. We are connected with all the major payment processors and can also integrate with internal ones, saving marketers time and resources from doing it themselves.
To maintain customer retention, learn how many customers are at risk for canceling. Our proprietary CancelGuardTM technology identifies at-risk customers who have turned off auto-renewal or are having billing problems. This data is exportable to give to retargeting providers.
Privacy-first, row-level data available
In spite of the sweeping changes that Apple has made around data privacy and consent regarding the Identifier for Advertisers (IDFA) for iOS, your first-party subscription data will not be affected. Thus, subscription app data is measured as first-party data, and identifiers used are the internal identifiers for the brand (eg, Identifier for Vendors [IDFV] for iOS, first-party customer IDs, and hashed email addresses.
With Kochava Subscriptions, marketers can get individualized data and by the household. Our platform can group users of multiple apps under one customer profile. With the average American household having on average 10 connected devices, our platform coalesces all devices so that marketers know the true value of customers across multiple apps and/or platforms.
Key features:
- Measure the full customer journey: From campaign ad to install, and trial signup to a paid subscription. We can map the entire user journey.
- Connect with any payment processor: We support Google Play, the App Store, Stripe, and even in-house or custom payment processing systems.
- Manage the health of your auto-renewal process: CancelGuardTM identifies customers at risk for canceling albeit for voluntary (eg, turn off auto-renew) or involuntary (eg, billing error) reasons.
- Visualize individual customer profiles with transaction history: Access row-level and exportable customer data to CRM for data enrichment or retargeting.
- Gain one-click access to KPIs like monthly recurring revenue (MRR), trial success rate, and churn and recovery rates.
- Visualize customer data with easy-to-access graphs that can be segmented, cohorted, and filtered.
- Understand unique customers by household: Get household identity to better understand how households engage with subscription apps via multiple smart devices.
- Get advanced growth insights with Kochava FoundryTM: Take subscriptions management to the next level with our strategic services arm who can work with marketers with customized needs.
“The most successful clients don’t always have the best reach, trial conversion rate, or other KPI (but they) are more efficient at approximating data by studying customers at the individual level and improving their communications with them and their offering.” -Kevin King, Subscriptions Architect, Kochava
For more information or to request a demo of Kochava Subscriptions, visit kochava.com/subscriptions.


